


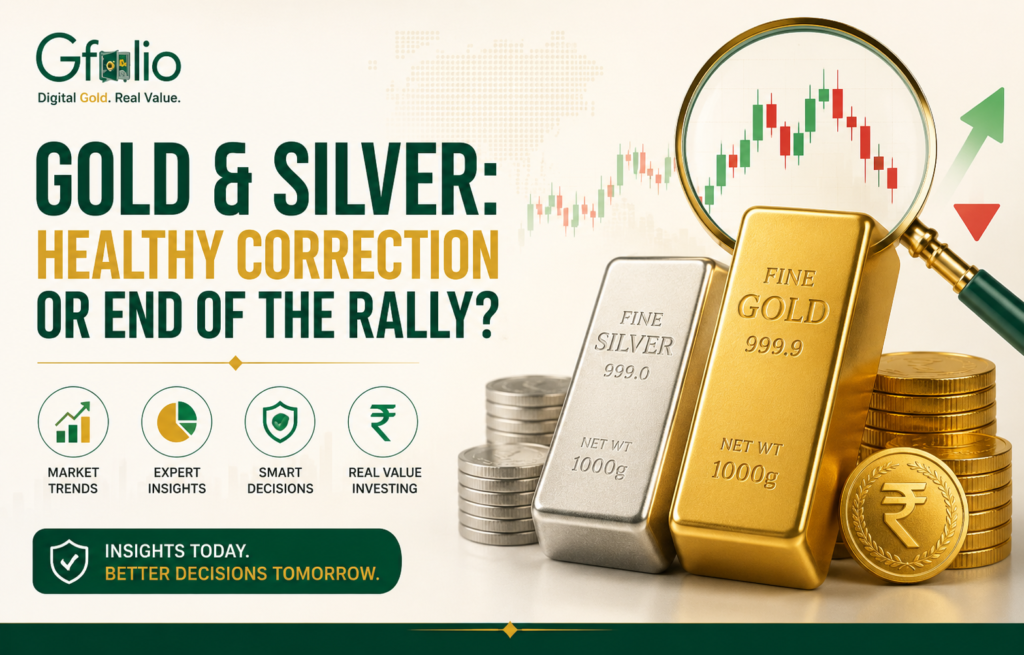
| The July 2026 drop in gold and silver is a correction inside a long bull market not the end of one. Gold’s all-time high was ₹1,83,000 per 10g (US$5,589/oz) in January 2026. It has since corrected roughly 22% to around ₹1,42,000. Silver peaked near ₹4,04,500/kg (~US$121/oz) and has corrected over 44% to around ₹2,25,000. Both remain dramatically above their 2024 and 2025 starting levels. The structural reasons that drove the rally central bank buying, inflation, geopolitics, silver’s industrial supply deficit have not gone away. Short-term volatility is real; the long-term case is intact. |
Where Prices Actually Stand Right Now: 2 July 2026
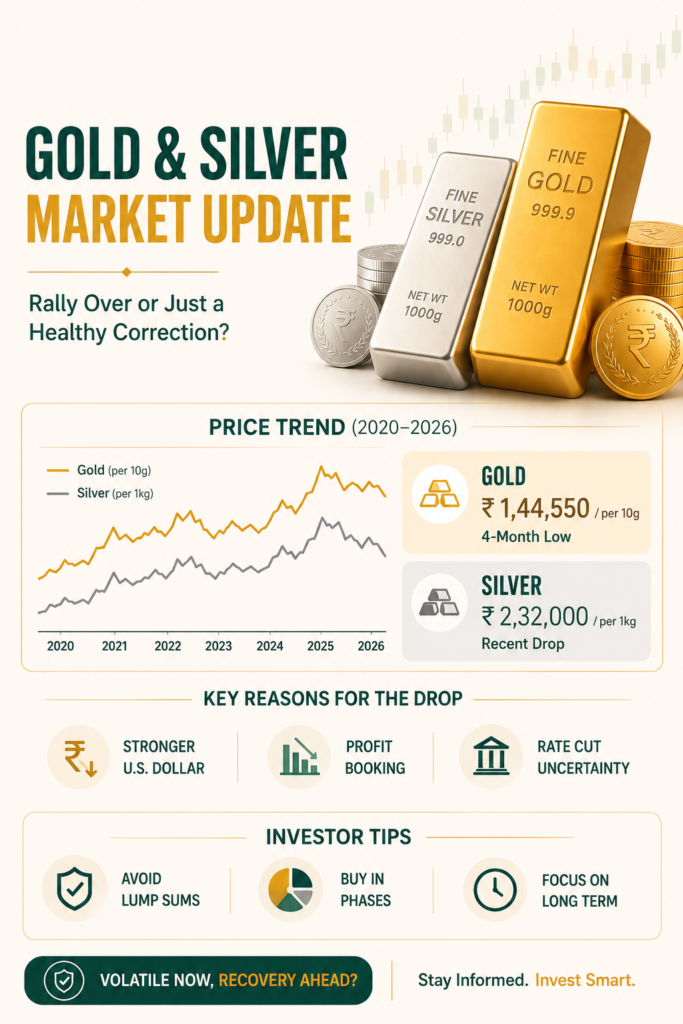
Before any analysis, here are the numbers as of July 2, 2026:
| Metal | Today (India) | Peak (Jan 2026) | Correction from Peak | vs Jan 2025 |
| 24K Gold | ₹1,44,550 per 10g | ₹1,83,000 per 10g | ~22% drop | Still up ~70%+ |
| Silver 999 | ₹2,32,000 per kg | ₹4,04,500 per kg | ~44% drop | Still up ~130%+ |
| Comex Gold | ~US$4,026 per oz | US$5,589 per oz | ~28% drop | Up ~65%+ |
| Comex Silver | ~US$60 per oz | US$121 per oz | ~50% drop | Up ~100%+ |
Even after the correction, gold has delivered 70%+ returns for an Indian investor who held from January 2025. Silver, despite its steep pullback, is still up over 130% in the same window. The question is not whether the rally happened it clearly did. The question is what caused the pullback and what comes next.
What Actually Caused the Correction: 5 Real Reasons
1. The Warsh Shock: A New Fed Chair Changed the Narrative Overnight
The single biggest catalyst for gold’s correction in 2026 was not an economic data point it was a personnel change at the US Federal Reserve.
On January 30, 2026, when Kevin Warsh was nominated as the new Fed Chair, gold futures dropped 16% intraday and silver crashed 39% in a single session. Warsh, known since his dissent against QE in 2010, is widely seen as a hawkish central banker with a deep focus on price stability over economic stimulus. Markets immediately re-priced the “easy money” premium that had been baked into gold since 2024.
At his first FOMC meeting (June 17, 2026), Warsh held rates steady at 3.50–3.75% but did something unusual: he declined to submit his own dot-plot projection, becoming the first Fed Chair in 14 years to skip the forecasting tool. The remaining 18 FOMC members leaned hawkish, with nine now projecting at least one rate hike before end-2026. Markets now price a 67% probability of a hike in September.
| Why this matters for gold Higher interest rates raise the “opportunity cost” of holding gold an asset that pays no yield. When you can earn 4.5%+ on US Treasury bonds, the case for holding gold weakens in the short term. However, markets already priced a hawkish Warsh back in January. Much of this headwind is already in the price. |
2. Dollar Strength: The Global Tax on Gold
The US Dollar Index (DXY) has climbed to levels last seen in May 2025, driven by the hawkish Fed outlook and relative US economic resilience. Since gold is priced globally in US dollars, a stronger dollar makes it more expensive for buyers in India, China, and other major markets which directly reduces demand and weighs on prices.
Indian investors feel this doubly: a stronger dollar also weakens the rupee, which can partially offset international price falls when converted to INR. This is why gold’s correction in rupee terms (22%) has been notably shallower than its correction in dollar terms (28%).
3. Treasury Yield Spike
US 10-year Treasury yields have pushed to around 4.46–4.5%, their highest in months. Higher real yields make government bonds more attractive relative to gold, pulling investment flows toward fixed-income assets and away from precious metals. As CNBC noted on July 1, 2026: gold hit its lowest level since November, partly because the yield spike was outpacing oil price moves, weakening the inflation-hedge narrative temporarily.
4. Profit-Taking After a Parabolic Rally
Gold gained ~29.5% in January 2026 alone, according to Kitco market data. Silver surged over 120% in 2025 and entered 2026 at multi-year highs. When any asset moves that fast, large institutional holders funds, ETFs, leveraged futures accounts take profits. This is not panic selling; it is orderly position reduction. Silver’s annualised volatility before the drop was around 36%, nearly double gold’s 20%. A correction of this magnitude is part of silver’s normal market behaviour.
5. Geopolitical Risk Premium Fading
A significant portion of gold’s January 2026 rally was a geopolitical risk premium — driven by the Iran conflict, Strait of Hormuz disruptions, and associated crude oil price spikes (Brent above $90/barrel). As US-Iran diplomatic talks in Doha showed progress in late June 2026, Brent fell below $80, reducing the inflationary oil shock that had accelerated safe-haven buying. When the risk premium fades, gold gives back the reactive gains — while the structural gains tend to hold.
Is This a Healthy Correction or the End of the Rally?
| The short answer This is a healthy correction. Gold has declined 14% in Q2 2026 its worst quarterly performance in years. But Blue Line Futures (July 1, 2026 analysis) notes this pullback has brought metals back to levels last seen in late 2025, and the structural drivers of the rally central bank buying, inflation above target, industrial silver demand remain fully intact. The bull case has not broken. The price has adjusted to reflect new monetary policy expectations. |
Here is how to read the difference between a correction and a trend reversal:
| Signal | Healthy Correction | Trend Reversal |
| Central bank buying | Continues above 1,000t/year — China, Poland, India all buying | Would stop or reverse sharply |
| Inflation | US CPI still at 4.2% YoY (May 2026) above the 2% target | Would fall to and hold below 2% |
| Silver industrial demand | Solar, EVs, AI driving structural deficit 6th year running | Industrial demand would collapse |
| Long-term analyst targets | JP Morgan ~$5,055/oz by Q4 2026; Goldman $5,400 target held | Would be revised sharply downward |
| Seasonal pattern | Gold historically strengthens July–August (Blue Line Futures) | No seasonal support |
| Investor positioning | ETFs saw outflows means less leveraged long pressure going forward | Already over-owned with no room for new buyers |
Why the Structural Case for Gold Is Still Intact
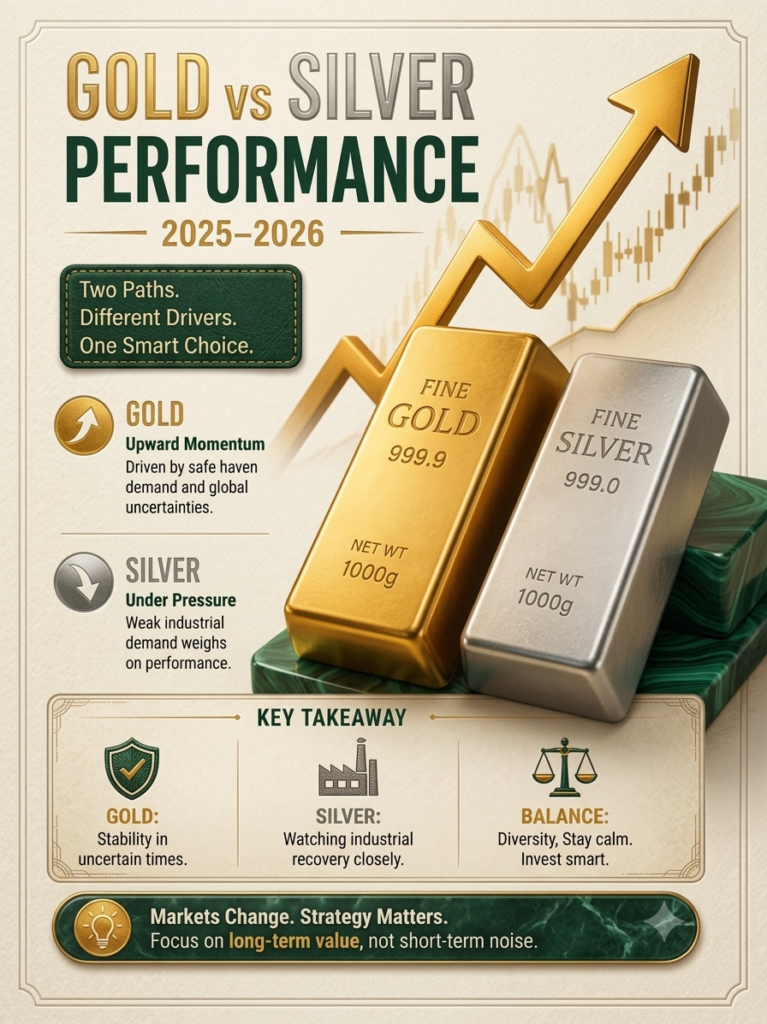
Gold’s long-term bull market is driven by factors that operate on years, not quarters:
- Central Bank Demand: Global central banks bought roughly 850 tonnes of gold in 2025, the third-highest on record (WGC, Feb 2026). Poland led 2026 buying with 20+ tonnes, while China’s PBOC added 25 tonnes in February alone, bringing its total to 2,257 tonnes. India’s RBI holds approximately 880 tonnes. A 2025 WGC survey found 95% of central banks expect global gold reserves to rise further in 2026.
- US Debt Reality: The US is projected to spend over $1 trillion on debt interest this fiscal year more than its defence budget. The structural pressure to accommodate government borrowing creates a floor for gold regardless of who chairs the Fed. Goldman Sachs reaffirmed its $5,400 year-end target even after gold’s worst monthly drop in over a decade.
- Indian Demand Remains Strong: India’s total gold demand rose 10% year-on-year to 151 tonnes in Q1 2026 (WGC India Focus Q1 2026), with investment demand (bars, coins, ETFs) hitting 82 tonnes; a record. Digital gold via UPI quadrupled year-on-year in January–February 2026. Even at elevated prices, Indian buyers did not step back — they shifted from jewellery to investment formats.
- Warsh’s Position Is More Nuanced Than Markets Initially Priced: On July 2, 2026, gold gained over 2% after softer ADP jobs data and after Warsh publicly stated that inflation expectations and inflation risks have come down. That single comment pushed gold above $4,089. The hawkish narrative, priced in since January, is already partially unwinding.
Why Silver Is a Different Story and Why That’s Actually Good News
Silver’s 44% correction from its January peak feels brutal. But silver always moves more than gold in both directions. Silver has a market roughly 1/10th the size of gold’s, which means the same capital flow creates a much larger price move. Silver is higher-beta gold, not broken gold.
The structural reasons to hold silver look even stronger than for gold:
- Industrial demand accounts for ~59% of silver use (BlackRock, Jan 2026). Solar photovoltaic panels alone consumed nearly 29% of total silver industrial demand in 2024, up from 11% in 2014. This grows every year.
- A sixth consecutive year of global supply deficit is projected for 2026 (Silver Institute data). The global shortfall in 2025 was estimated at ~230 million ounces. Mining supply cannot respond quickly ore grades are falling, and new mines take years to bring online.
- India is now the world’s largest importer of refined silver importing approximately US$9.2 billion in 2025, a 44% jump despite prices nearly tripling (Macquarie data). Consumers substituting silver for expensive gold, plus booming solar and electronics manufacturing, drove this.
- JP Morgan projects silver at an average of $81/oz in 2026 more than double its 2025 average. Silver is currently trading around $60, which means even the JP Morgan base case implies meaningful upside from today’s level.
| ~22% Gold corrected from Jan peak | ~44% Silver corrected from Jan peak | 850t Central bank gold buying, 2025 | 6th yr Global silver supply deficit |
The 4 Signals You Should Watch Right Now
| Signal | What to Watch | Why It Matters |
| US Jobs & CPI Data | July 3 Payrolls; July CPI release | Soft data reduces rate hike probability → gold rallies; hot data → more pressure |
| Dollar Index (DXY) | Sustained strength above 105 | Caps gold upside for non-US buyers; rupee weakness can partially offset in INR |
| Fed Dot Plot & Warsh Comments | Sintra conference (July 2); any signalling on September | Any dovish tilt = gold recovery; hawkish surprise = more pressure near-term |
| Seasonal Pattern | Gold historically strengthens July–August | Blue Line Futures July 1 analysis flagged this as an active tailwind opening now |
Investor Playbook: What to Actually Do Right Now
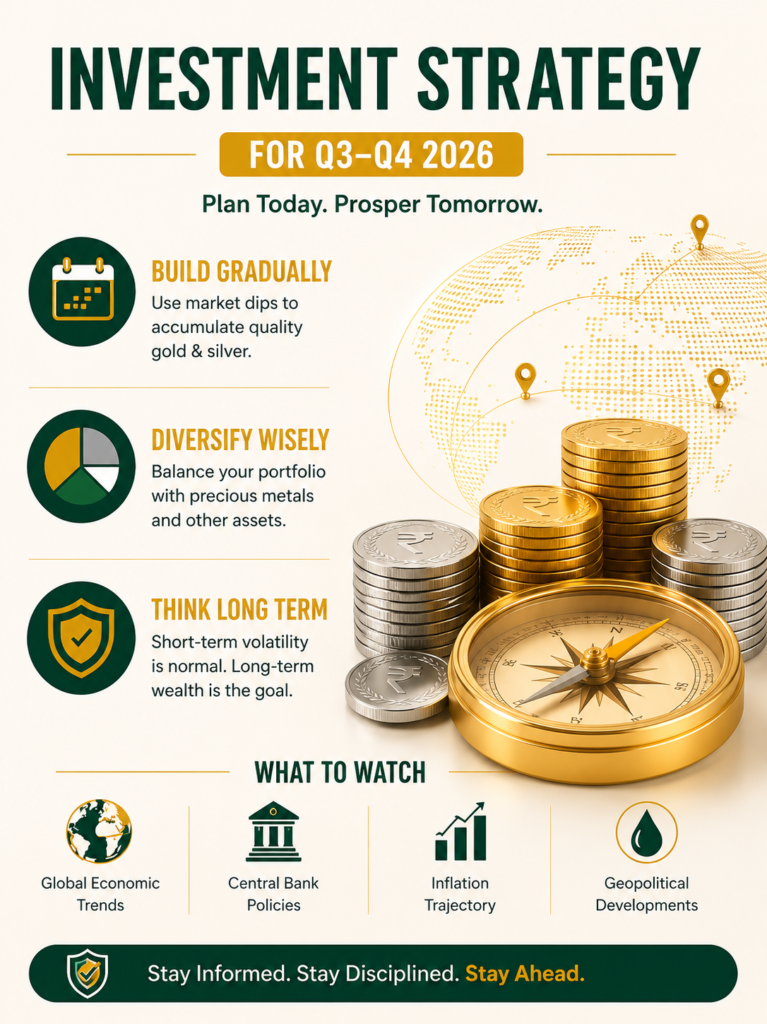
Three types of situations, three different approaches:
If You’re a First-Time Buyer
This is actually a more attractive entry point than January 2026. You’re buying gold roughly 22% cheaper and silver roughly 44% cheaper than the all-time highs, with the structural case intact. Do not try to catch the exact bottom. Start a small, regular SIP (daily or weekly) so you buy across different price levels and reduce your average cost over time.
| GFolio Gold SIP Start a Gold SIP from ₹5/day on GFolio. Buy automatically across price levels, powered by Augmont’s BIS-certified refinery, stored in SEBI-regulated insured vaults. No timing required. |
If You’re Already Holding
Volatility is part of precious metals investing, it is not a signal to sell. Gold has delivered roughly 15% annualised returns over 20 years; that return includes corrections exactly like this one. If your investment horizon is 3+ years, the right action during a healthy correction is to hold, and optionally add through phased purchases rather than lump sums.
If You’re Considering Large Lump-Sum Entry
Avoid a single large purchase when you can’t predict near-term direction. A phased approach spreading your intended investment across 3–6 months removes the timing risk. The WGC notes that even a 10–15% further fall would likely attract strong buying from consumers, long-term investors, and central banks, limiting further downside. But buying in tranches means you benefit from any further dip automatically.
Why GFolio Makes Corrections Less Stressful
When you hold physical gold at home or in a bank locker, a correction forces a decision: do you sell, hold, or buy more? That decision requires you to trust your own timing.
With GFolio, the decision is already built into your strategy:
- Gold SIP auto-buys at the prevailing price on your set schedule so a correction means your SIP automatically picks up more gold per rupee, lowering your average cost without any action on your part.
- Instant liquidity if you genuinely need cash during a market event, you can sell digital gold 24×7, not just during market hours or at a jeweller’s counter.
- No purity anxiety your digital gold and silver is already BIS-certified 24K/999 purity through Augmont’s NABL-accredited refinery. No re-testing on withdrawal coins and bars arrive pre-certified with HUID codes.
- Portfolio dashboard see your exact holding value at current prices in real time, not once a quarter.
Frequently Asked Questions
Q. Is the gold price crash in 2026 permanent?
No. Gold peaked at ₹1,83,000/10g in January 2026 and has corrected ~22%. This is in line with normal bull-market corrections. The structural drivers — central bank buying, inflation, dollar debt — have not changed. Major banks including Goldman Sachs and JP Morgan have maintained or adjusted their year-end 2026 targets upward from today’s levels.
Q. Should I buy gold or silver during this correction?
Both are more attractively priced than they were in January 2026. For lower volatility and a store-of-value focus, gold is the steadier choice. For higher potential upside (and higher risk), silver has stronger industrial demand tailwinds but corrects more sharply. A mix through a regular SIP in both is the most risk-managed approach.
Q. What is the gold price target for Q4 2026?
JP Morgan projects gold to average around US$5,055/oz by Q4 2026. Goldman Sachs has a $5,400 year-end target. These are analyst projections, not guarantees, but both were reaffirmed after the correction. At current levels (~$4,026), they imply meaningful upside if the macro backdrop softens.
Q. Why did silver fall more than gold?
Silver is roughly 1/10th the size of gold’s market, so it is more volatile in both directions. Silver also has a larger industrial demand component, making it sensitive to global growth expectations. When risk sentiment softens and investors take profits, silver moves faster. But silver also tends to lead on the way back up.
Q. Is this a good time to start a Gold SIP?
Yes in fact, corrections are precisely when SIPs work best. A regular SIP means you buy more units when prices are lower and fewer when they are higher, naturally averaging your cost down over time.
Q. How can I invest in digital gold through GFolio?
Download the GFolio app, complete a quick KYC, and start a Gold or Silver SIP from as little as ₹5. Your holdings are backed by Augmont’s BIS-certified refinery and stored in SEBI-regulated insured vaults.
The July 2026 correction in gold and silver is real, and the near-term could stay volatile. A hawkish Fed, a strong dollar, and fading geopolitical risk premium are legitimate headwinds. But none of these factors have broken the structural case for precious metals.
Gold has corrected 22% from a record high but remains up roughly 70% from January 2025. Silver has corrected 44% but remains up over 130% from January 2025. Central banks are still buying. Silver deficits are still widening. US debt is still climbing. Inflation is still above target.
Corrections are the price of long-term gains in precious metals. The investors who benefit most are the ones who keep buying consistently through them.
Start or continue your Gold SIP on GFolio from ₹5, any time, fully certified by Augmont’s BIS-accredited refinery.